
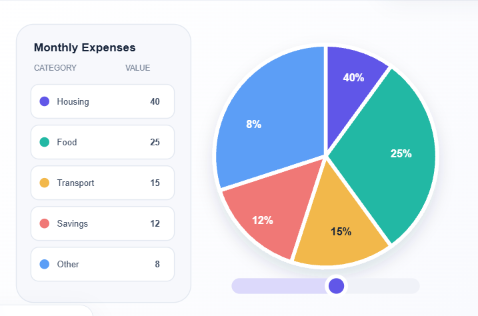

The Importance of Pie Charts in Modern Data Visualization
Data plays an important role in everyday decision-making. Businesses, students, researchers, and professionals regularly work with numerical information to understand trends, compare results, and communicate findings. However, large amounts of numbers can sometimes be difficult to interpret. Data visualization helps solve this problem by transforming numerical information into clear and meaningful visuals.
Among the different types of charts available, pie charts are particularly useful for displaying percentages and proportions. Their circular format makes it easier to understand how individual categories contribute to an entire dataset. Whether used in business reports, educational projects, or research presentations, pie charts provide a simple way to communicate important information.
Understanding How Pie Charts Work
A pie chart is a circular graph divided into several sections, with each section representing a category within a dataset. The size of each section depends on its proportion of the total value.
For example, a company might use a pie chart to explain how its annual budget is distributed across marketing, salaries, technology, transportation, and administration. Each category receives a segment based on its percentage of the overall budget.
This visual approach allows readers to understand the distribution of information without examining lengthy spreadsheets. By using different colors and clear labels, creators can make charts even easier to interpret.
Benefits of Using Pie Charts
One of the biggest advantages of pie charts is their simplicity. They present information in a familiar visual format that most audiences can understand without specialized knowledge.
Another benefit is their ability to highlight proportions. When comparing categories that form part of a complete dataset, pie charts help readers quickly recognize which sections represent larger or smaller contributions.
Pie charts are also useful in presentations because they make numerical information more engaging. Instead of displaying multiple rows of figures, professionals can use a single chart to communicate the main findings.
Additionally, pie charts can support better communication between teams, helping employees, managers, and stakeholders understand important information more efficiently.
Using Pie Charts in Business Reports
Businesses collect information about sales, expenses, customers, marketing campaigns, and operational performance. Organizing this information into understandable reports is essential for evaluating progress and identifying opportunities.
Pie charts can help companies present financial distributions, product sales percentages, and customer demographics. For instance, a business can create a chart showing how its revenue is divided among different product categories.
Marketing teams can also use pie charts to present advertising budget distribution or customer survey results. These visuals make reports easier to follow and help decision-makers focus on important information.
Pie Charts in Education and Research
Pie charts are valuable educational resources because they help students understand percentages, fractions, and proportions through practical examples.
Teachers can use them to explain how information is distributed across different categories. Students can also create charts for classroom assignments, science projects, and statistical presentations.
Researchers frequently work with survey responses and numerical findings. Pie charts provide a convenient way to summarize certain types of research data, such as demographic distributions and preference percentages.
Presenting research findings visually can make complicated information more accessible to readers and audiences.
Tips for Creating Clear and Effective Pie Charts
Creating an informative pie chart requires more than simply entering numbers. A few basic practices can improve the quality and readability of the final result.
Use accurate information: Always check your data before creating a chart. Incorrect values can produce misleading visual representations.
Choose meaningful categories: Organize information into clear groups so readers can understand what each section represents.
Select suitable colors: Use contrasting colors to distinguish different segments without making the chart visually overwhelming.
Include descriptive labels: Add category names and percentages where appropriate to help readers understand the information.
Avoid too many sections: Charts containing too many small segments can become difficult to interpret. Combining closely related categories may improve readability when appropriate.
Following these practices helps create professional charts that communicate information effectively.
Making Chart Creation Easier with Modern Tools
Technology has made data visualization more accessible than ever. Users no longer need advanced graphic design experience to prepare attractive charts for their projects and presentations.
Online chart-making solutions provide convenient ways to organize numerical information and turn it into visual content. Students can prepare academic assignments, businesses can develop reports, and researchers can present statistical findings more clearly.
For anyone looking for a convenient chart-making solution, PieMakerCo offers an opportunity to make pie chart creation simpler and more accessible. Having an easy-to-use chart-making resource can save time and help users focus on understanding and presenting their data.
Conclusion
Pie charts remain useful tools for presenting percentages, comparing proportions, and explaining numerical information. Their simple structure makes them suitable for business reports, educational assignments, research projects, and professional presentations.
By selecting accurate data, organizing categories properly, and using clear labels and colors, anyone can create meaningful visual representations.
As the importance of data continues to grow, effective visualization will remain an essential skill. Using suitable chart-making tools and following good presentation practices can help transform complex numbers into clear insights and support better communication.