
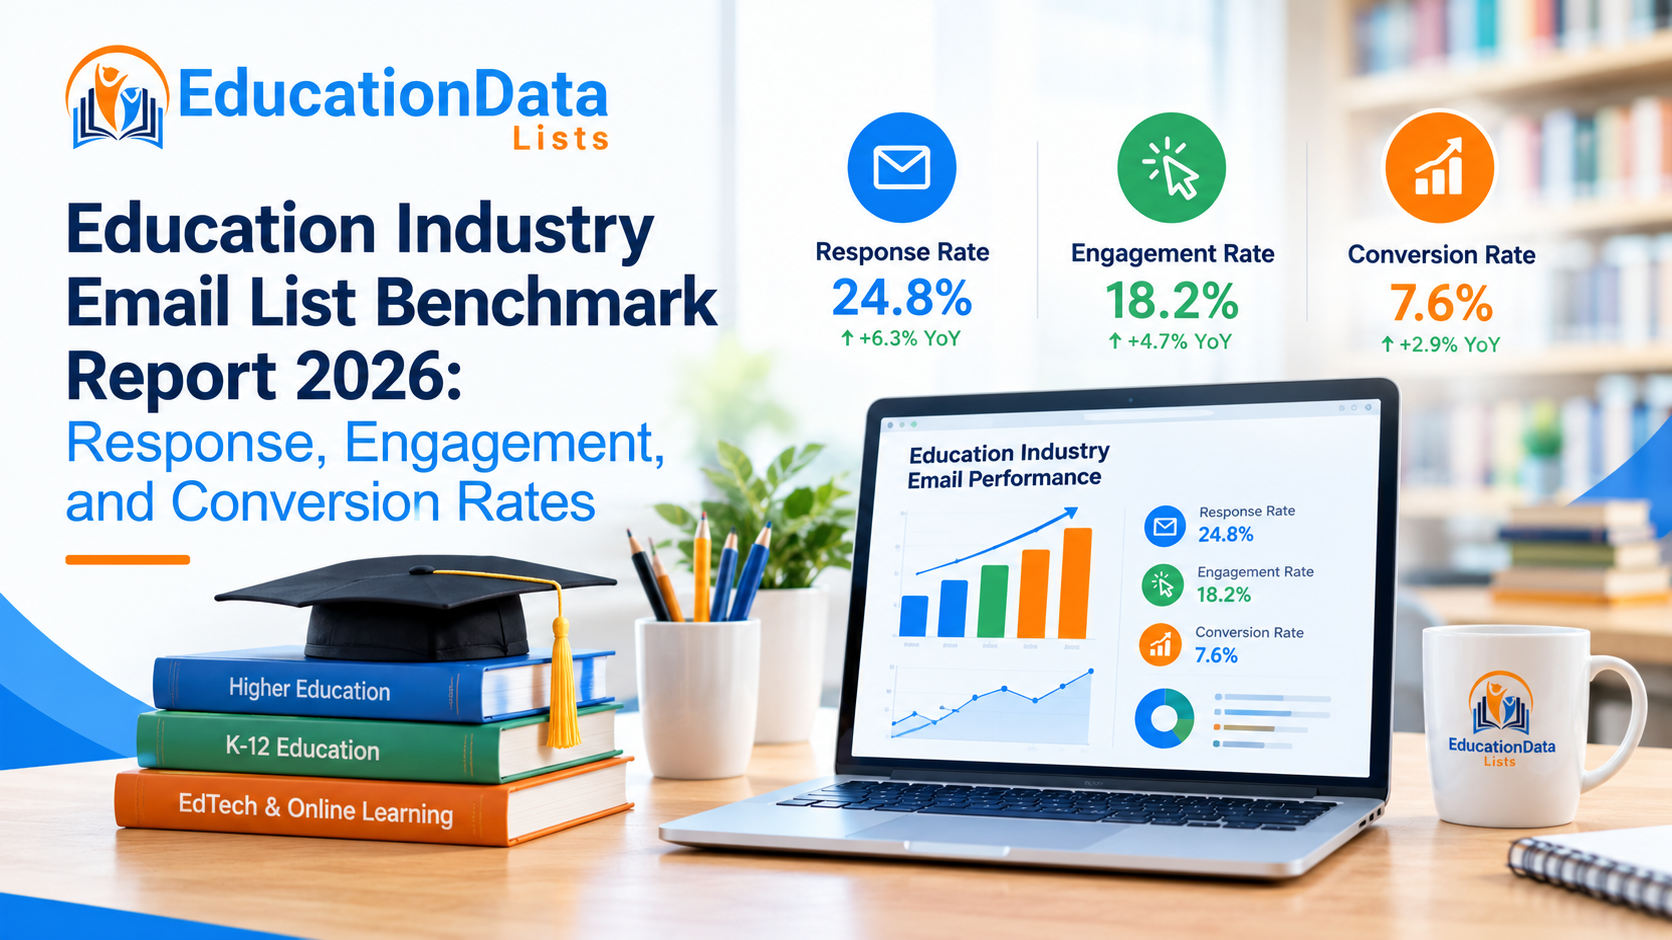
Education Industry Email List Benchmark Report 2026: Response, Engagement, and Conversion Rates | EducationDataLists

The latest email benchmarks show that education-related campaigns can generate meaningful engagement, but response, engagement, and conversion should not be treated as the same metric. MailerLite's 2025 dataset of more than 3.6 million campaigns recorded a 1.93% median click rate for educational institutions and a 7.03% click-to-open rate, compared with 2.09% and 6.81% across all industries.
For marketers using an Education Industry Email List, the numbers suggest that relevance and audience quality matter more than simply increasing send volume. This 2026 benchmark report examines education-sector email engagement, broader B2B response data, conversion benchmarks, deliverability, data quality, and the practical implications for teams building an Education Industry Email Database.
What Are the Latest Education Email Marketing Benchmarks?
MailerLite's latest benchmark report analyzed more than 3.6 million campaigns sent from 181,000 approved accounts between December 2024 and November 2025. The overall median open rate was 43.46%, click rate was 2.09%, click-to-open rate was 6.81%, and unsubscribe rate was 0.22%.
For the educational institution category, the reported benchmarks were:
| Metric | Educational institutions | Overall benchmark |
|---|---|---|
| Open rate | Not separately highlighted in the dataset's summary table | 43.46% |
| Click rate | 1.93% | 2.09% |
| Click-to-open rate | 7.03% | 6.81% |
| Unsubscribe rate | 0.17% | 0.22% |
The most useful comparison is the relationship between clicks and opens. Educational institutions recorded a slightly lower click rate than the overall benchmark, but their 7.03% click-to-open rate was above the 6.81% all-industry figure.
That suggests a useful interpretation: once recipients open an education-related email, the content can generate engagement at a reasonable rate. The challenge may therefore be less about producing clicks from every recipient and more about reaching the right audience with sufficiently relevant messaging.
How Should Marketers Interpret a 1.93% Education Click Rate?
A 1.93% click rate means that approximately 1.93% of recipients clicked a link in the campaigns represented by MailerLite's educational-institution category. It does not mean that 1.93% of cold prospects will respond or become leads.
That distinction is critical when evaluating an Education Industry Mailing List.
Email marketing benchmarks generally include audiences that have already subscribed, interacted with an organization, or otherwise entered an established marketing relationship. Cold B2B outreach operates under different conditions.
For comparison, Belkins analyzed 7,530,489 cold emails sent during 2025 and reported a 0.45% overall reply rate when replies were divided by total emails sent. The study deliberately used total sends as its denominator rather than opens.
Therefore:
-
1.93% click rate = education email-marketing engagement benchmark.
-
0.45% reply rate = broad B2B cold-outreach benchmark.
-
Neither figure is a guaranteed benchmark for an individual Education Industry Email List.
Keeping those definitions separate prevents misleading performance comparisons.
What Does Current Education Market Size Mean for List Coverage?
The U.S. education market contains a very large and diverse potential audience.
NCES reported 99,073 operating public elementary and secondary schools and 19,183 operating public school districts in 2024–25, serving approximately 49.27 million students.
NCES also reported that the 99,073 public schools included:
-
90,249 regular schools
-
1,859 special-education schools
-
1,587 career and technical schools
-
5,378 alternative schools
-
8,048 charter schools
For marketers, this demonstrates why a single broad education audience can become difficult to manage.
A technology provider targeting district IT leaders has a different ideal audience from a publisher targeting teachers. A higher-education software company may need university administrators, while a K–12 curriculum provider may prioritize curriculum directors and school leaders.
Consequently, an Education Industry Email Database should be evaluated not only by record count but also by coverage of the specific education segments that matter to the campaign.
Which Education Segments Should Marketers Measure Separately?
A broad education list can conceal major differences between audiences.
Useful segments include:
K–12 school districts
District-level campaigns may involve superintendents, curriculum leaders, technology officers, finance executives, procurement staff, and other administrators.
Teachers and instructional staff
Teacher-focused campaigns may need grade-level, subject-area, school, district, and geographic segmentation.
Higher education
Universities and colleges often involve multiple stakeholders across technology, academic affairs, procurement, student services, and administration.
Education technology decision-makers
CoSN's 2025 State of EdTech District Leadership report found that 80% of respondents worked in districts with generative-AI initiatives, while 94% of EdTech leaders saw AI's potential for positive impact in education.
That means an education technology campaign should not necessarily treat every education contact as equally relevant.
A cybersecurity vendor, for example, may need a substantially different segment from a classroom-content provider.
Does Education Email Engagement Support Personalization?
Current marketing research suggests that personalization remains difficult even as AI makes content production easier.
Salesforce's 2026 State of Marketing report surveyed nearly 4,500 marketers and found that 75% had adopted AI, while 78% said they needed more personalized content than they could produce. At the same time, 84% reported running generic campaigns, and 69% struggled to respond promptly to customers.
This creates an important opportunity for education marketers.
Instead of sending one message to an entire Education Industry Email List, marketers can use available data to distinguish:
-
K–12 versus higher education
-
Public versus private institutions
-
Teachers versus administrators
-
Technology versus academic decision-makers
-
District versus school-level contacts
-
Geography
-
Institution size
-
Relevant technology initiatives
The purpose of segmentation is not to create dozens of tiny audiences. It is to make the message more closely match the recipient's professional context.
What Does Current EdTech Adoption Tell Us About Buyer Relevance?
Education buyers are dealing with rapidly changing technology requirements.
CoSN's 2025 research found that generative AI was the top technology priority, with 80% of respondents working in districts that had GenAI initiatives. The report also found that 61% of districts relied on general funds for cybersecurity, while 78% spent cybersecurity resources on monitoring, detection, and response.
These numbers illustrate why educational audiences should not be treated as a single market.
For example, an email promoting an AI teaching assistant may be relevant to a district experimenting with instructional GenAI but poorly aligned with a contact whose primary responsibility is network security.
The better strategy is to match:
Contact → Institution → Current priority → Product use case
That is where the value of a well-structured Education Industry Email List becomes more apparent.
What Are the Current B2B Cold-Email Response Benchmarks?
For prospecting campaigns rather than permission-based email marketing, current B2B data provides a useful reference point.
Belkins' 2026 study analyzed 7.5 million cold emails from 2025 and found:
-
Overall reply rate: 0.45%
-
Founders/owners: 0.57%
-
C-level executives: 0.42%
-
VPs: 0.32%
-
Companies with 0–10 employees: 0.72%
-
Companies with 10,000+ employees: 0.22%
Belkins also reported that Education was among the standout industries for reply rates, although its published headline does not provide a single education-specific percentage in the summary.
This is valuable evidence that education can be a receptive B2B outreach category, but the absence of a published education-specific percentage means marketers should not invent one or present the overall 0.45% figure as an education benchmark.
Woodpecker's current 2026 platform benchmark provides another reference point: its dataset of 56,614 campaigns recorded a 1.5% median cold-email reply rate and a 26% median open rate across 37,000 campaigns.
The different figures demonstrate why benchmark methodology matters.
What About Education Conversion Rates?
Conversion rates are even more dependent on funnel definition.
Unbounce's conversion benchmark data reports that email was the highest-converting traffic channel for education at 14.1%, compared with 7.3% for paid search and 5.1% for paid social.
However, this should not be interpreted as a 14.1% conversion rate for an email list.
Unbounce is measuring conversion from education landing-page traffic by channel, whereas MailerLite is measuring email engagement and Belkins is measuring cold-email replies.
The three datasets answer different questions:
| Metric | What it measures |
|---|---|
| MailerLite 1.93% | Email click engagement for educational institutions |
| Belkins 0.45% | Broad B2B cold-email reply rate |
| Unbounce 14.1% | Education landing-page conversion from email traffic |
This separation is essential when establishing campaign KPIs.
Which Metrics Should an Education Marketer Track?
A strong campaign dashboard should move beyond open rate.
MailerLite notes that Apple Mail Privacy Protection can inflate recorded opens because Apple Mail may automatically mark messages as opened. The company therefore identifies click rate as a more reliable engagement indicator because it does not depend on open tracking.
For an education campaign, consider tracking:
-
Delivery rate
-
Bounce rate
-
Click rate
-
Positive reply rate
-
Qualified lead rate
-
Meeting-booked rate
-
Landing-page conversion
-
Opportunity creation
-
Pipeline generated
-
Unsubscribe rate
This creates a more complete picture of whether the list, message, offer, and landing experience are working together.
Why Does Education Contact Data Need Continuous Maintenance?
Data quality is becoming increasingly important as sales and marketing teams integrate AI into prospecting.
Salesforce's 2026 State of Sales found that 74% of sales professionals were focusing on data cleansing, while 79% of high performers prioritized data hygiene compared with 54% of underperformers. Salesforce also found that 51% of sales leaders using AI said disconnected systems were slowing their AI initiatives.
For education marketers, data hygiene includes more than checking whether an email address is syntactically correct.
A quality process should verify:
-
Contact role
-
Institution
-
School or district affiliation
-
Department
-
Geographic location
-
Email validity
-
Duplicate records
-
Leadership changes
-
Opt-outs and suppression records
-
Verification date
The more complex the education buying committee, the more important those fields become.
What Can EducationDataLists Contribute to a Better Campaign?
For marketers and sales teams that need education-sector contacts, EducationDataLists can serve as a resource for building or supplementing a targeted Education Industry Email Database.
The practical value comes from combining contact coverage with segmentation and verification rather than simply maximizing the number of records.
A campaign could, for example, separate K–12 administrators from teachers, higher-education decision-makers from instructional staff, or technology leaders from academic stakeholders. Marketers can then align each segment with its specific message, landing page, offer, and conversion objective.
The database is the starting point; campaign measurement determines whether the targeting actually works.
5 Practical Ways to Improve Education Email Performance in 2026
1. Separate engagement from conversion
Do not use one KPI for every stage. Track clicks, replies, qualified leads, meetings, and downstream conversions separately.
2. Segment by professional role
A superintendent, teacher, CIO, curriculum director, and procurement professional can have very different priorities even when they work for the same institution.
3. Segment around current education priorities
AI, cybersecurity, interoperability, data privacy, instructional technology, and digital infrastructure are all active areas of K–12 technology activity. CoSN's research provides evidence of particularly strong AI and cybersecurity activity.
4. Measure clicks more heavily than opens
Because open tracking is increasingly unreliable, click rate and downstream actions provide stronger evidence of engagement.
5. Maintain database quality
Salesforce's 2026 data shows that data cleansing is already a priority for 74% of sales professionals. Education marketers should similarly treat data maintenance as an ongoing campaign process rather than a one-time task.
Key 2026 Education Email Benchmarks at a Glance
The current evidence can be summarized as follows:
-
1.93% — educational-institution median email click rate in MailerLite's 2025 dataset.
-
7.03% — educational-institution click-to-open rate.
-
0.17% — educational-institution unsubscribe rate.
-
43.46% — overall MailerLite median open rate across 3.6 million campaigns.
-
2.09% — overall median click rate.
-
0.45% — Belkins' 2025 cross-industry cold-email reply rate using total sends as the denominator.
-
1.5% — Woodpecker's current median cold-email reply rate across 56,614 campaigns.
-
14.1% — Unbounce's education conversion rate for email traffic, measured at the landing-page conversion level.
These figures should not be combined into a single “education email conversion rate.” Each measures a different stage or type of campaign.
Conclusion
The 2026 evidence shows that education email marketing has measurable engagement potential, but the performance of an Education Industry Email List depends heavily on how the audience and funnel are defined. MailerLite's 1.93% educational-institution click benchmark and 7.03% click-to-open rate provide a useful email-engagement reference, while broader cold-outreach research demonstrates that response rates depend strongly on methodology and recipient context.
For education marketers, the most defensible strategy is therefore not to chase one universal benchmark. Instead, build a clean and segmented Education Industry Email Database, align messaging with institutional priorities, measure clicks and qualified responses, and connect email activity to downstream conversions. As AI, cybersecurity, and digital infrastructure continue reshaping education, accurate audience data will become increasingly important for making every outreach interaction more relevant and measurable.
Frequently Asked Questions
1. What is the average email click rate for the education industry?
MailerLite's 2025 benchmark reported a 1.93% median click rate for educational institutions, based on more than 3.6 million campaigns across its overall dataset. This is an email-marketing benchmark, not a guaranteed rate for every education campaign.
2. What is a good education email engagement rate in 2026?
There is no single universal target because engagement varies by audience, campaign type, and measurement methodology. The latest MailerLite benchmark gives educational institutions a 1.93% click rate and 7.03% click-to-open rate as useful reference points.
3. What is the education industry cold-email response rate?
A definitive education-specific cold-email reply rate is not publicly established in the latest benchmark research reviewed. Belkins reported a 0.45% overall B2B reply rate across 7.5 million cold emails sent in 2025, while noting Education among its standout industries, but it does not publish a specific headline education percentage in that study.
4. What is the education industry email conversion rate?
There is no single conversion rate for all education email campaigns because “conversion” can mean a click, lead, application, meeting, enrollment, or purchase. Unbounce reports a 14.1% conversion rate for education traffic originating from email, but this is a landing-page traffic benchmark rather than a direct email-list conversion rate.
5. What should an Education Industry Email List contain?
Depending on the campaign, useful fields include contact name, professional email, institution, school or district, job title, department, location, institution type, and verification date. Additional segmentation fields should be included only when they support a specific targeting or personalization strategy.
6. Why is segmentation important for education email campaigns?
Education is a highly diverse market encompassing K–12 schools, districts, universities, colleges, teachers, administrators, technology leaders, and other stakeholders. Current CoSN research, for example, shows substantial district activity around GenAI and cybersecurity, illustrating why technology-focused campaigns may require different audiences and messages.
7. Should education marketers focus on open rate or click rate?
Click rate is generally more useful for evaluating engagement because open tracking can be distorted by privacy features such as Apple Mail Privacy Protection. MailerLite specifically identifies click rate as a more reliable engagement indicator because it does not depend on open tracking.
8. How large is the U.S. K–12 education market?
NCES reported 99,073 operating public elementary and secondary schools and 19,183 public school districts in 2024–25, with approximately 49.27 million students.
9. How often should an Education Industry Email Database be updated?
There is no universal refresh interval, but education contact data should be reviewed continuously because people change roles, institutions, and responsibilities. Salesforce's 2026 sales research reinforces the broader importance of ongoing data cleansing, with 74% of sales professionals reporting that they focus on it.
10. What are the most important education marketing metrics in 2026?
A useful dashboard should include delivery, bounce rate, click rate, positive replies, qualified leads, meetings, landing-page conversion, opportunities, pipeline, and unsubscribes. Looking at the full funnel prevents marketers from mistaking high engagement at one stage for successful revenue or enrollment outcomes.